Changelogs
Stay up to date with the latest changes and enhancements.
Stay up to date with the latest changes and enhancements.

24. Jul 2026
Share
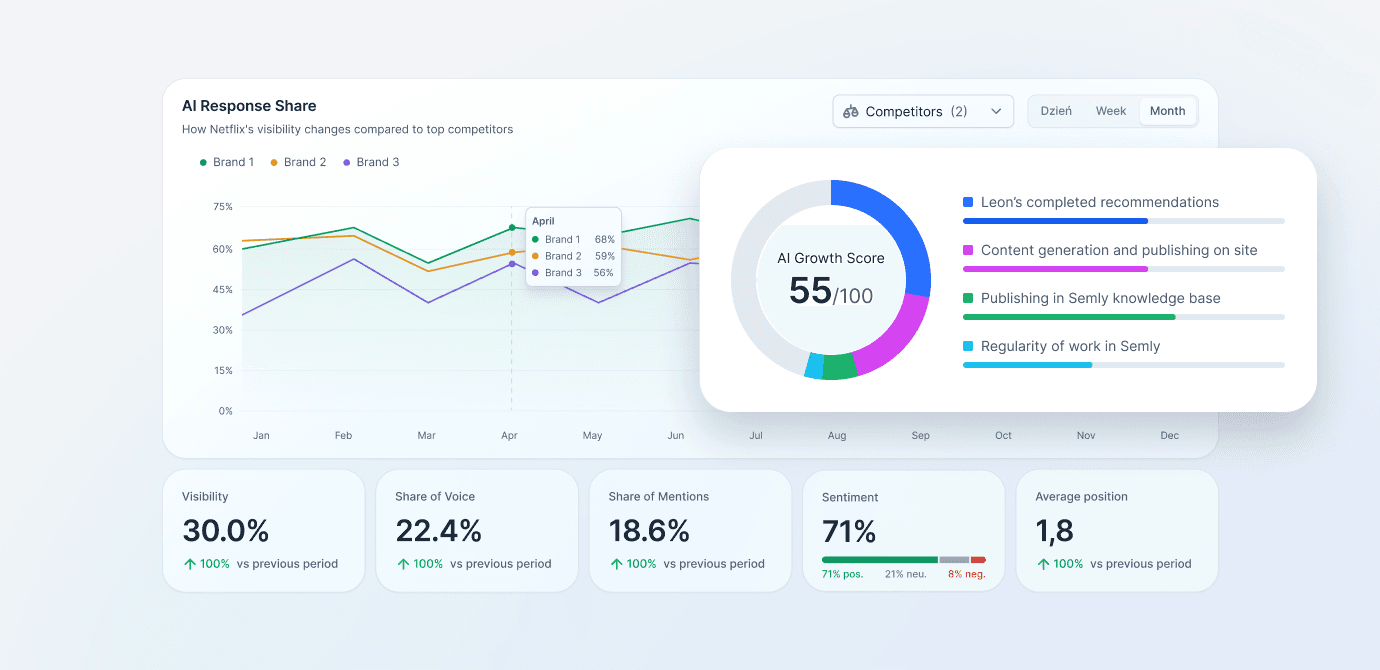
We've released a completely new brand visibility report in AI models. This is one of the most important changes in Semly, because the report not only shows current results, but also helps you understand where they come from, how your brand compares to competitors, and what you need to do to continue improving them.
In one place, you can now analyze visibility, positions, citations, sentiment, and brand activity in your selected period. Results can be filtered by AI models and groups of monitored prompts, called Topics.
Results are compared to analogous data periods, e.g. month to month.
The most important novelty is AI Growth Score. It's a metric on a scale from 0 to 100 that measures the level of engagement in activities that increase your brand's visibility in AI model responses.
AI Growth Score analyzes activity from the last 30 days in four areas:
implementing recommendations prepared by Leon,
creating content and publishing it on your brand's website,
publishing content in Semly's Knowledge Base,
regular work with Semly reports and tools.
This way, you can immediately tell whether a brand is systematically working towards further growth. A high visibility score alone shows the current situation, while the AI Growth Score tells you whether the necessary actions are being taken to maintain and improve that position.
A low score doesn't mean a brand is invisible today. However, it's a signal that a lack of regular activity could slow growth over time and make it easier for competitors to take over visibility.
The new report presents a set of metrics that allow you to look at brand visibility from several perspectives:
Shows the percentage of analyzed AI model responses in which the brand appeared. By comparing it with the previous period, you can quickly check whether visibility is growing, declining, or staying at a similar level.
Shows the brand's share in all mentions of monitored brands, compared to the specified competition. This allows you to assess how much of the "voice" in AI responses the brand occupies and who currently dominates in a given category.
Indicates the average position at which the brand was mentioned when it appeared in a response. The closer to the first position, the greater the chance that the user will notice the brand and treat it as the model's main recommendation.
Shows what proportion of all citations and sources used by AI models are materials related to the brand. It allows you to assess whether AI not only mentions the brand but also uses its website and content as a source of knowledge.
Determines the context in which the brand appears in AI responses. The report shows the share of positive, neutral, and negative statements, which helps quickly identify potential issues in how the brand is presented.
Each metric is calculated for the selected period. The report can be additionally filtered by AI models and Topics to check results for a specific group of questions, products, or business area.
The new chart Share in AI Responses shows how the brand's visibility changes against monitored competitors.
You can use it to check:
whether the brand is gaining or losing share in responses,
which competitors are growing the fastest,
when a significant change in results occurred,
how actions taken in Semly affect visibility over time.
Data can be analyzed on a daily, weekly, or monthly basis and compared with selected competitors.
Simply having a brand appear in an AI response is not everything. It's also important which position the model mentions it in.
The new report shows the percentage distribution of positions from 1st to 4th for your brand and competitors. This allows you to check how often AI indicates the brand as the first recommendation and how often it places it in later positions.
This way you can distinguish between mere presence in responses and actual recommendation strength. A brand mentioned most often in the first position has a better chance of attracting user attention and influencing their purchasing decision.
In the report, you can now check the ranking of domains and pages most frequently cited by AI models during the analyzed period.
For each source we present:
number of citations,
average position in responses,
percentage share in analyzed responses.
The ranking shows where models draw knowledge about a given category and which domains have the greatest impact on generated recommendations. It also allows you to find valuable sources used by AI and better understand why the competition achieves specific results.
In the monitored prompts table, we added a visibility filter that allows you to quickly separate questions where your brand appears from those where it is still invisible.
This makes it easier to:
find the biggest visibility gaps,
identify prompts requiring further action,
see questions where your brand is already recommended,
assess its position and sentiment for each prompt.
This is particularly useful when planning future content. Leon can use the detected gaps to prepare materials that answer questions where competitors are visible, but the brand hasn't appeared yet.
The new report combines three key perspectives:
result, meaning how often and at what position the brand appears in responses,
competitive environment, meaning who gains the largest share and where they win,
actions, meaning whether the brand regularly performs the tasks needed for further growth.
This makes it easier to move from simply observing results to making concrete decisions. The report shows where the brand is already winning, where it's losing to competitors, and which areas are worth focusing on for future actions.
The new visibility report is now available in Semly. Check your results, compare them with competitors, and see what you can do to increase the number of recommendations for your brand in AI responses.