Changelogs
Stay up to date with the latest changes and enhancements.
Stay up to date with the latest changes and enhancements.

13. May 2026
Share
We’ve introduced a new feature that makes it easier to analyze data in Semly. From now on you can organize results faster, filter the most important information, and adjust views to your own way of working.
The new options are available in all key views in the Semly panel.
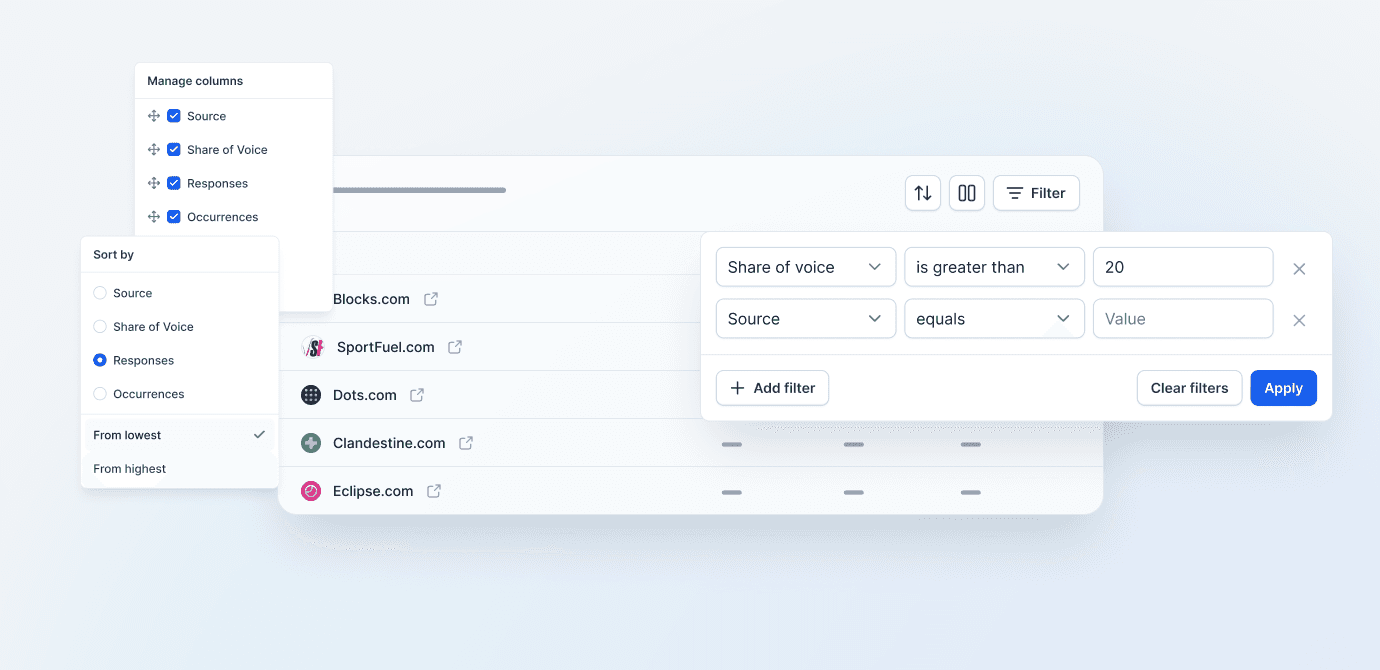
We’ve added three practical features:
Data filtering
You can narrow the view down to only those results that meet selected conditions. For example: show sources whose Share of Voice is higher than 20, or display only specific domains, brands, responses, or mentions.
Sorting results
You can now sort data by the most important parameters, including by source, Share of Voice, number of responses, or number of mentions. This way you’ll find the most important elements faster.
Managing columns
You can adjust every view to your needs. You only enable the columns that are needed for a given analysis, and you can hide the rest. This helps tidy up the screen and focus on the most important data.
Semly analyzes a large amount of information from AI responses, sources, prompts, brands, and competitors. The new options let you move from data to conclusions faster.
Thanks to filters, sorting, and column management, it’s easier to check:
which sources have the biggest share in AI answers
where your brand shows up most often
which domains affect your competitors’ visibility
which results need deeper analysis
which data is currently the most important for your report
The new options are especially useful for people who regularly analyze brand visibility in AI, compare themselves with competitors, check citation sources, or work with a larger number of prompts and topics.
This is another step towards more transparent, flexible, and practical AI Visibility analytics in Semly.
Filtering, sorting, and column management options are available directly in report and table views in the Semly panel. Just use the icons above the table to tailor the data to your own analysis.